Identify and Analyze your Bottlenecks, sync engineering efforts with business objectives, and reach your KPIs faster using DORA Metrics, the DX & SPACE Framework.
Data Extraction
Get instant insights into your engineering efforts! We measure your industry-standard metrics.
Evaluation
METRX pinpoints bottlenecks and opportunities for greater efficiency and output in an easy-to-read, personalized dashboard.
Optimization
Use METRX findings to create new performance protocols or seek Gigster’s expertise to address issues.
How It Works
1. Data Extraction
METRX’s algorithms check the Git repository’s metadata and the tech stack (programming languages, libraries, and frameworks).
2. Data Evaluation and Analysis
METRX analyzes your code and all its’ history from the repository alongside project and ticket based data from your issue tracking system. A comparative analysis is completed against individuals, teams and projects to understand your engineers’ activities as they stand today.
3. Review
The METRX team reviews all data with you for a thorough understanding of your team and further refines any reporting, instantly resulting in a customized view of your organization.
4. Resolve
Once a review is complete, you’re in control of the following steps:
• Resolve any bottlenecks by leveraging Gigster’s ten years of experience • Resolve any bottlenecks found using your internal resources • Continue to monitor your team’s progression every month
1-Minute METRX Summary Video
METRX Reports
Every METRX report is tailored to showcase the specific information you need to understand about your organization. Curious to learn more? Check these examples below:
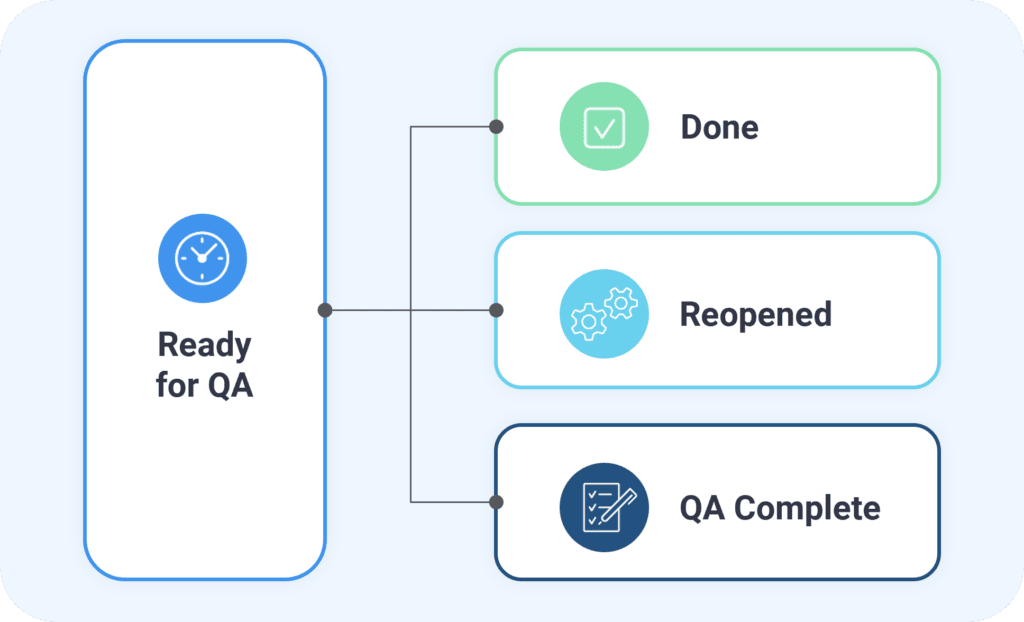
Issue Status Flow Chart (For Engineering Leaders)
What does it show? This reports shows how many times the tickets are failing or passing. This chart can be generated per project, developer for a selected time interval.
For the selected issue status (Ready for QA in the given example) it shows what other statuses the issues transitions into.
Why is it useful? Every SDLC has an ideal flow from the start status to the desired end status. However in some cases the issue has to go back into a previous status because of quality issues (failed code review, failed QA, etc.).
Testimonial: "First, we were happy our code review acceptance rate is 96%. After that it turned out our code review process has serious flaws. Even bad codes passed passed too many times."
Ticket Cycle Time (For Engineering Leaders)
What does it show? It shows an average of how much time it takes per status of a ticket. Project management tool Jira(EG)
Why is it useful? Ideally you want your cycle time to be short. It enables your team to reach fast, get a short feedback loop and iterate fast.
Longer cycle time means there are bottlenecks in the SDLC (Software Development Life Cycle).
Testimonial: "Following the right metrix the team is now motivated to work on smaller tickets. That helped us to deliver faster smaller chunks of improvements and reduce the number of big risky deployments."
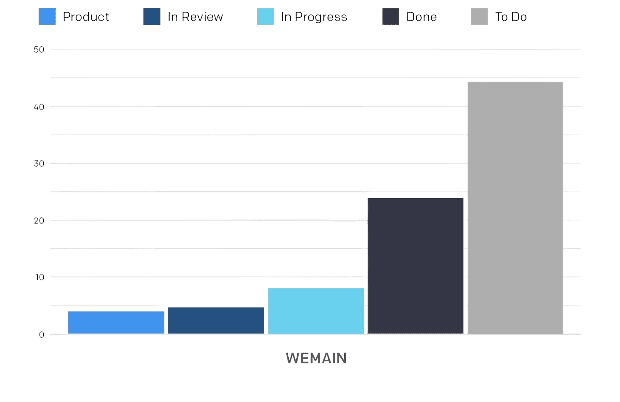
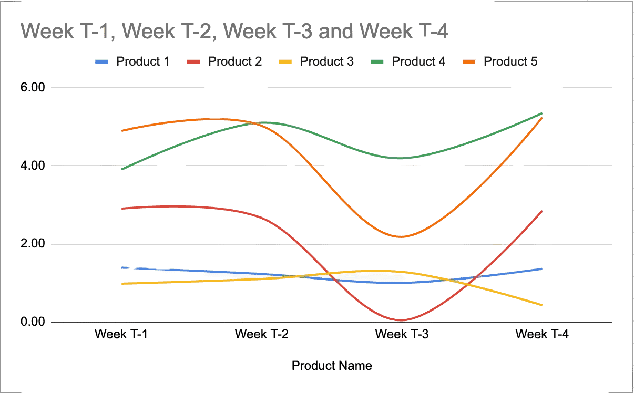
Code Contribution By Product Per Week (For Engineering Leaders)
What does it show? How the development teams’ overall contribution is distributed between the products,within a selected time period.
Why is it useful? - Shows if the developers are working on the right products. - Identifies how much efforts they put into each product. - Helps to understand how development speed changes per project over time. - Works without time-tracking.
Testimonial: "We realized most of our engineering output was allocated to experimental projects and the real revenue-generating project was understaffed."
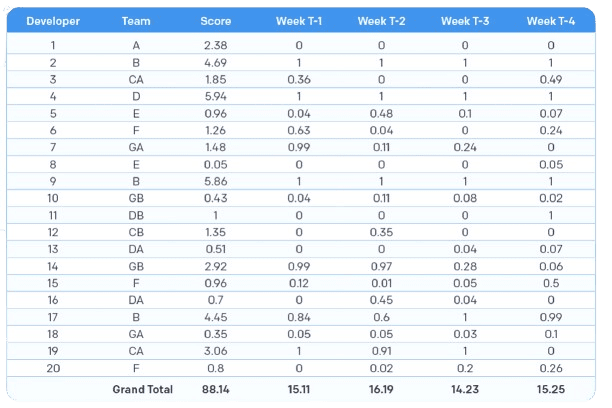
Weekly Code Contribution Per Developer (For Engineering Leaders)
What does it show? The total weekly code contribution within a time period, calculated as a score, per developer.
Score (code contribution): It’s the sum of the code contribution per developer. It can reach a maximum of 1 point/week/dev. 1k (or more) lines of code added or changed per developer per week equal to 1. That’s the maximum reachable score per week.
So 1 developer in 4 weeks can reach a maximum score of 4. Same score of 4 can be also reached as maximum by 4 devs in 1 week. Score is comparable between teams/companies as same logic is used.
Why is it useful? Understand team members’ contribution over time.
Testimonial: "Thanks to METRX we are able to measure how new developers are catching up. I helped us to optimize our onboarding and new hires started to be more productive sooner."
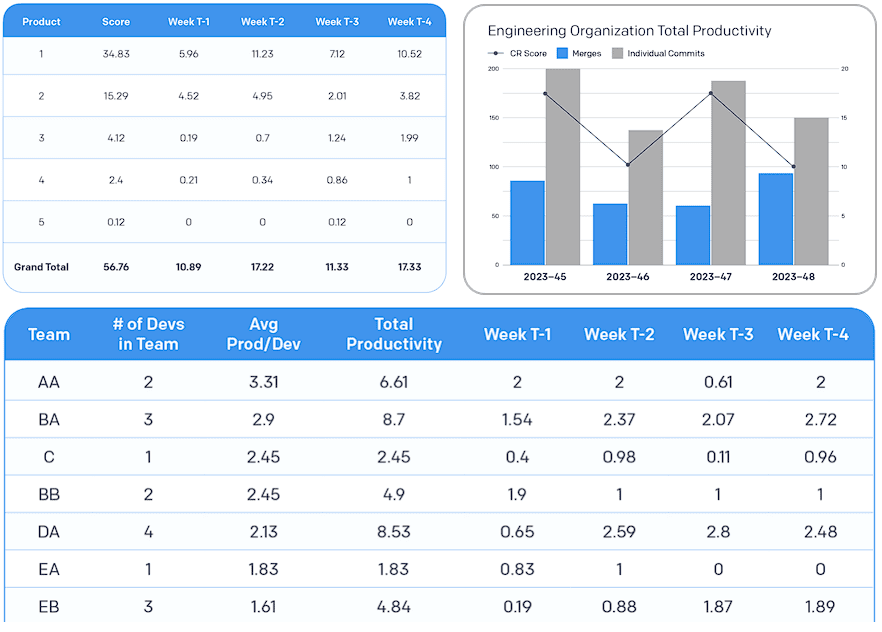
Weekly Code Contribution Per Team / Product / Entire Org (For Engineering Leaders)
What does it show? The team's’ code contribution per week within a given time range (Example: within the last year).
Why is it useful? - Gain insight into the extent to which teams contribute through the deployment of new code and code modifications.
- This aids in identifying teams facing obstacles in their code contribution efforts.
Testimonial: " Thanks to METRX we learned that one of our team had a declining trend in their productivity. Once we clearly saw it the team leader could jump in and started to remove obstacles. "
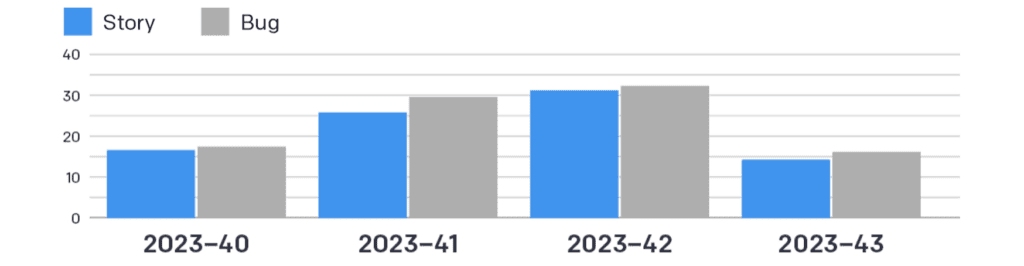
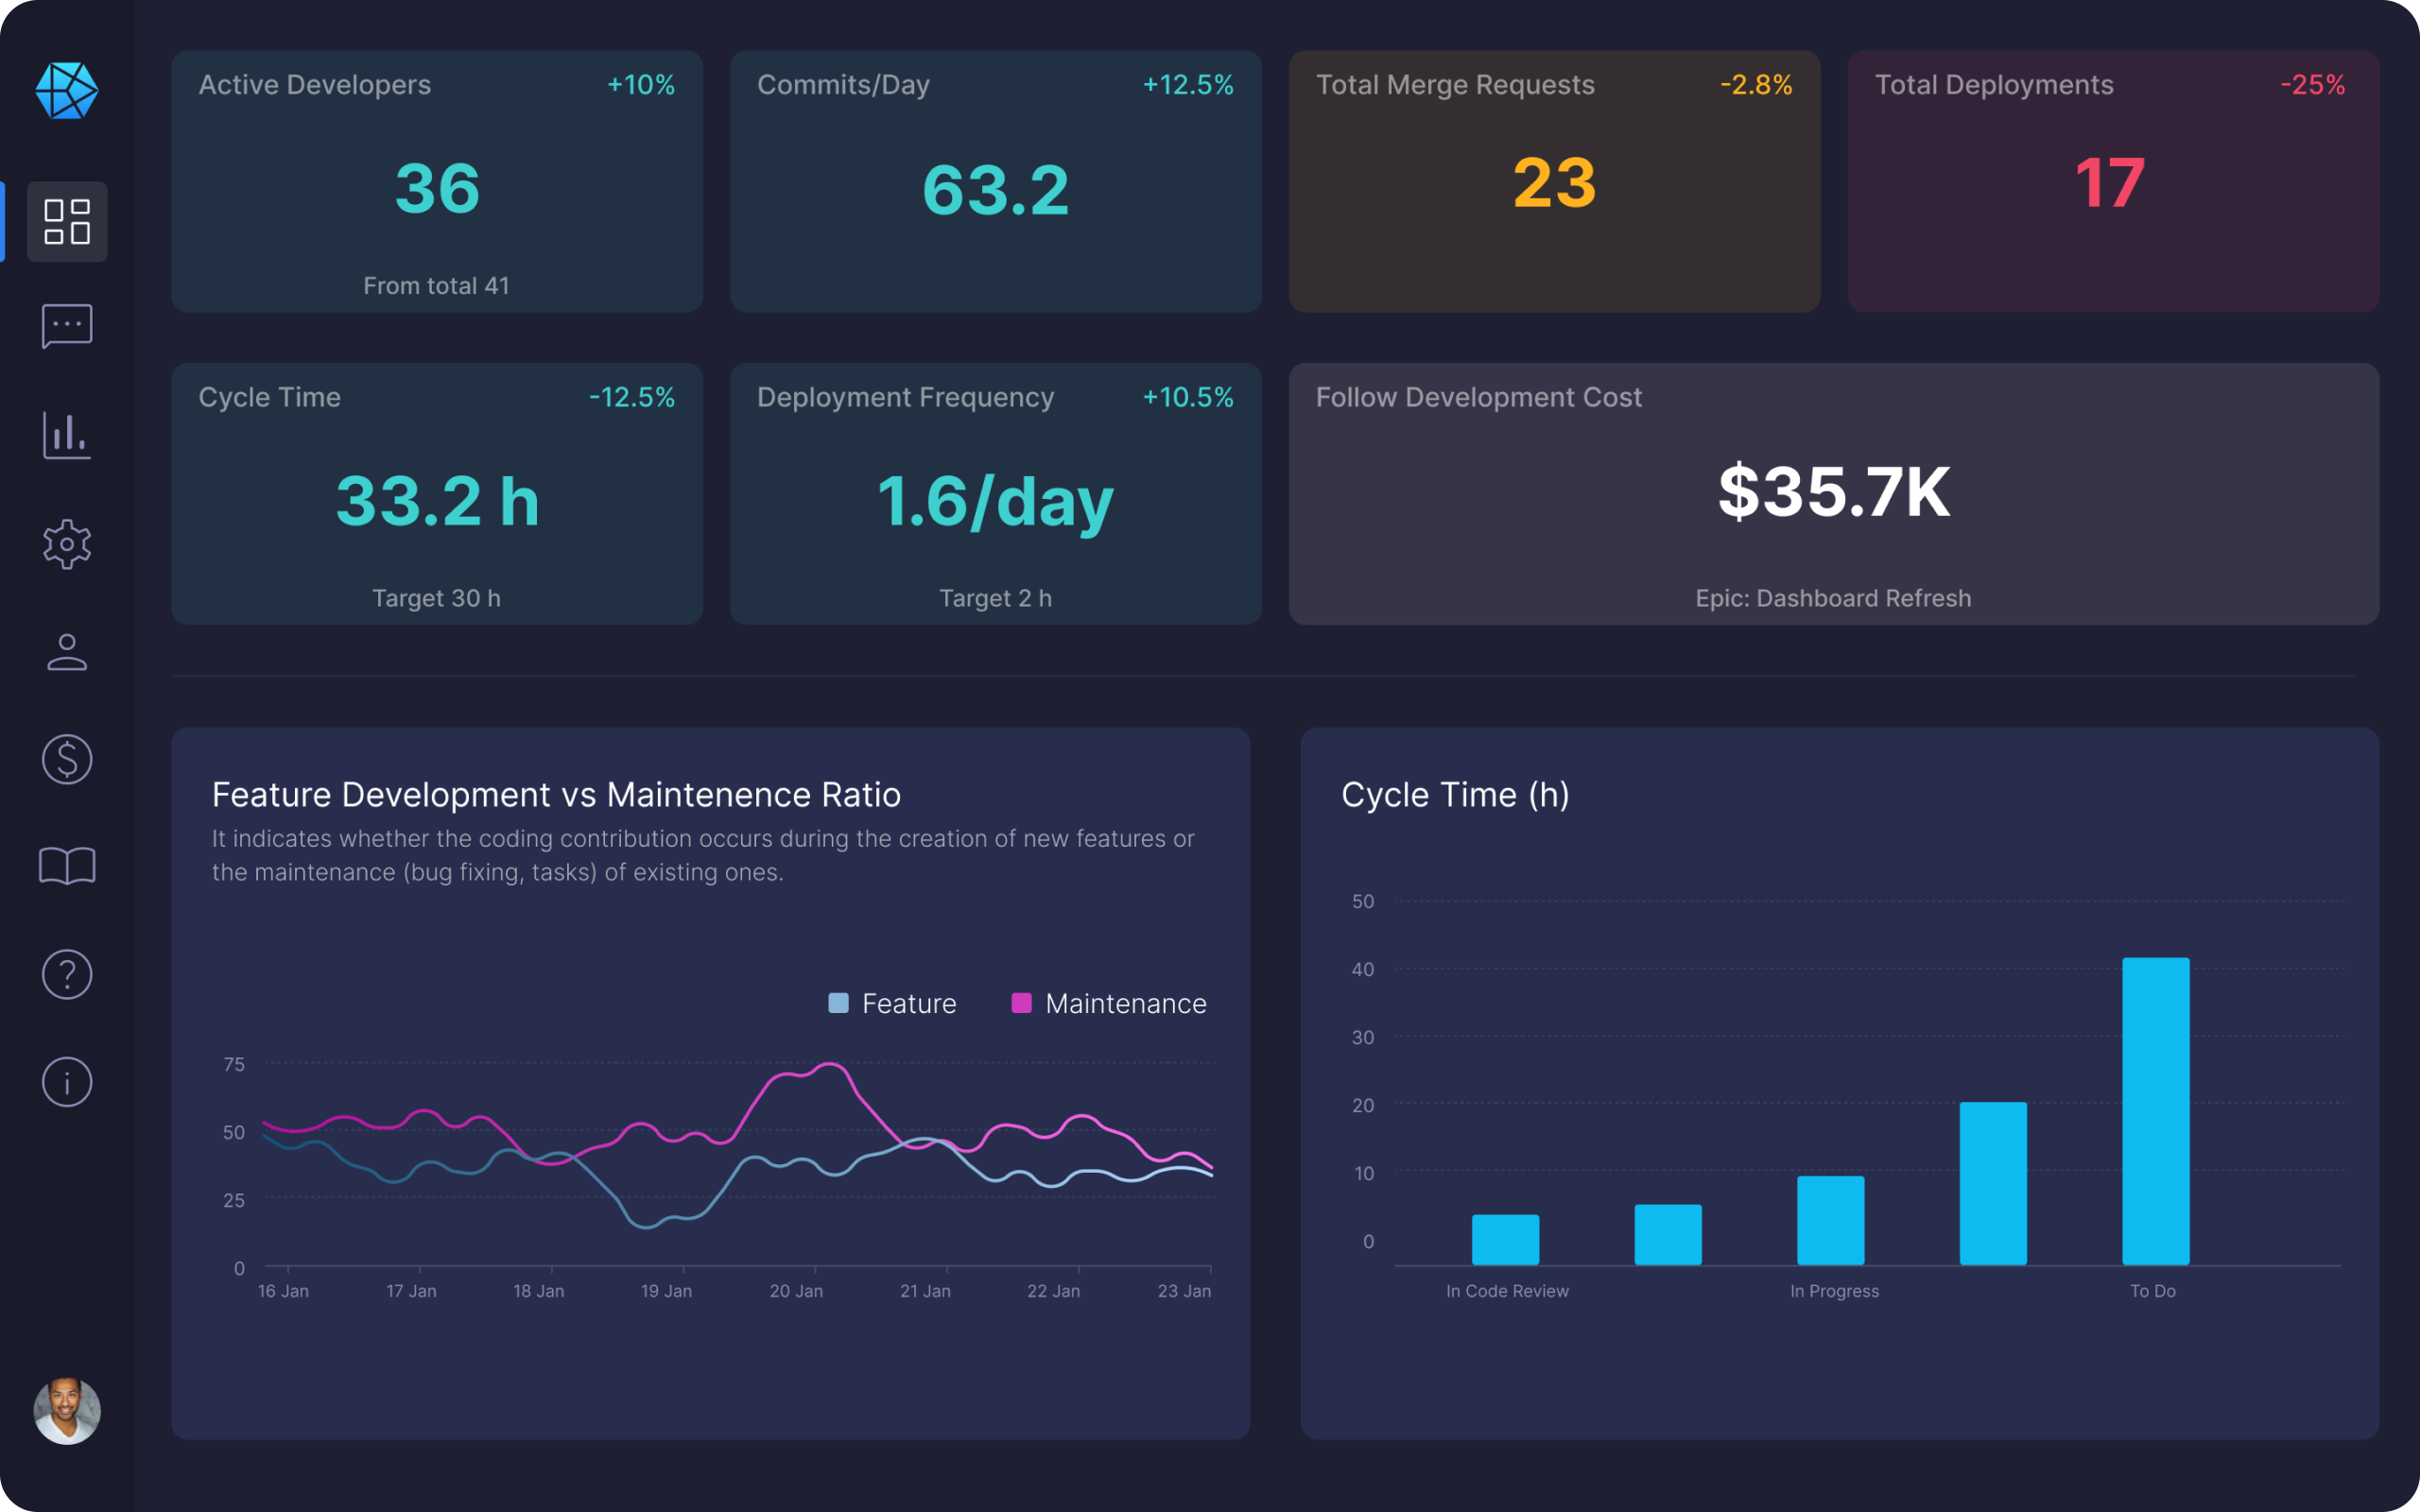
Feature Development Vs Maintenance Ratio (Executive Level Report)
What does it show? It indicates whether the coding contribution occurs during the creation of new features or the maintenance of existing ones. Provides information regarding the allocation of engineering resources between the development of new features and maintenance tasks.
Why is it useful? In an ideal scenario, bug fixing should account for less than 30% of the total workload. Even without time tracking, we can assess the extent of engineering resources dedicated to maintenance, which offers a more precise measurement than merely tallying ticket numbers in JIRA.
Testimonial: " The biggest take away was developers could work only on the roadmap up to 50% of their capacity. We had to better distribute work between developers so they can focus more on important developments. "
Feature vs. Bug Development Based on Productivity
Feature vs. Bug Development Based on Number of Issues
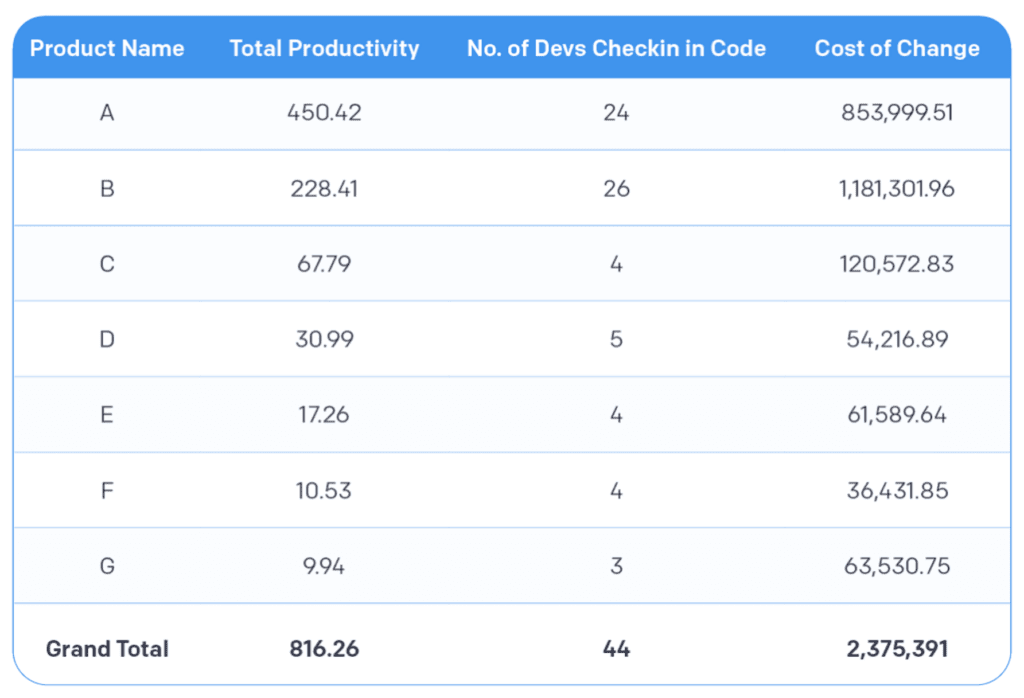
Cost Per Product (Executive Level Report)
What does it show? The estimated cost of the development of products based on the developers code contribution and salary in the last year. We can create the report on both commit/ticket/epic/project level.
Why is it useful? We can offer a highly accurate estimate of the engineering expenses for product development even without the use of time logging.
Testimonial: "We got valuable feedback immediately how engineering dollars are spent between projects and who are the most expensive developers. We analysed those and understand how to avoid expensive mistakes."
Get Your Dashboard Now
A free assessment may include servicing teams of 5-40 engineers, and require access to HR data with code stored in a GIT repository.
Your Reports Are Prioritized By Your METRX Dashboard
Your METRX dashboard provides you with a user-friendly interface that seamlessly connects to your data sources. Your data analysis, visualizations, and insights are only one step away. Rest assured, your data’s security is a top priority.
Advantages
Enhanced Security and Control
Keep your codebase private and maintain autonomy with a tailored solution that minimizes risks associated with third-party access.
Efficiency and Insights
Streamline report generation for more efficient data analysis while gaining valuable insights to make data-driven decisions.
Scalability and Cost-Efficiency
Accommodate growth and evolving needs with a scalable solution that also reduces external access and associated costs.
Why METRX?
End to End Solution
METRX caters to startups and up to enterprise-level companies, providing a customized solution.
Instant Engineering Insights
Using METRX gives you immediate insights into your engineering efforts.
You're In Control Of Your Data
On-premise solution is also available, which works without sharing any code with us.
Free Assessment
Your initial assessment is always free. Taking action on our findings through a paid offering is optional.
Flexible Risk Management
You don’t take any risk; you decide what to handle from the findings and how to proceed.
Benchmarking
Benchmark with other companies from your industry.
A METRX analysis was conducted within a software organization in the energy sector. Review this case study to understand the impact an objective analysis had within this organization.
Check How An Engineering Team Saved $700k+ With METRX
Where Can We Send Our Case-Study For You?
METRX By Role
For Engineering Managers
Facilitates data-driven decision-making, enables timely interventions aligning your actions with company goals. METRX’s reports promote a proactive approach to address issues and continuously improve your team performance.
METRX aligns with your goals through personalized reports. Each analysis promotes technical excellence, optimizes resource allocation, projects delivery and quality, enhances team collaboration, and supports strategic planning and talent development.
Empowers Finance leaders to make strategic financial decisions, optimize resource utilization, and ensure the company’s financial health with actual data.
Did METRX Uncover Issues Your Organization Can't Tackle Alone?
Unlike the competition, Gigster is a fully managed software delivery service. We specialize in assembling powerful teams in as little as 48 hours and have specialists around the globe who can solve your software problems. Assemble a Team On-Demand to self-manage one aspect of a project. Hire a Fully-Managed team for a hands-free custom software solution while you manage the other operations of your business.
5,000+
Deliverables
>95%
On-Time Delivery
60+%
Lower Risk
<10 Days
Average Staffing Time
30%
More Efficient Staffing
3.6x
Higher Project Satisfaction
Our proven model mitigates risk and assembles project-specific teams. With our high-quality roster of global software engineering talent, we can literally work on a project 24/7, assemble a team 3x faster than the competition, with 60% lower risk.
FAQ
Data Security and Implementation
We provide details on the tool’s data security measures and clarify the integration process, including the expected timeline. We secure data during transmission and while at rest.
Customization And Scalability
We employ a standardized enterprise visualization solution utilizing Google’s Data Management and Visualization tool, such as Google Looker Studio. The data is transferable to alternative platforms, such as Microsoft’s PowerBI, allowing seamless integration and direct data provision if you are already using a dashboard solution.
User Training And Support
We provide personalized onboarding sessions, comprehensive documentation, and responsive ongoing support to ensure a smooth and successful implementation of METRX.
What Metrx Measures
METRX measures the following aspects of the code contributions: code volume, frequency, technology, rank, and consistency.
Which Teams Can Benefit From Metrx
METRX can be exclusively used for engineering teams/organizations to assess software developers’ performance, not other teams’, like finance, HR, CS, etc. It evaluates software developers’ performance by examining their code contributions/commits within a defined period.
Companies Already Leveraging METRX with Confidence
Our Mission, Vision and What We Believe In As METRX
Our Vision
(What Do We Want To Achieve?)
To build the future of efficient, data driven software engineering teams.
Our Mission
(How Do We Get There?)
To greatly improve the cooperation between business and engineering teams based on objective, data-driven insights.
We Believe
(Core Values)
We believe goals are reached with a much higher certainty by aligning the engineering and business teams based on objective, data-driven insights. Our data analysis highlights those opportunities and threats which your engineering department face, both on team, project and process level. We empower engineering leaders to make the right decisions and improve their teams’ productivity. We foster collaborative excellence by recognizing that individual developers are integral parts of teams.
Our Related Products
METRX AI Assistant
The “Talk to Your Data AI Assistant” uses natural language processing and data analysis techniques to bridge the gap between you and your data. It enables you to interact with data as if you were conversing, making data analysis more accessible and intuitive.
METRX For Private Equities
Our solution empowers Private Equity firms with objective organization-wide assessments, facilitating data-driven cross-team comparisons. This is well-suited to handle the complexities and scale typically associated with enterprises.
Stay Informed: Subscribe to Gigster's Mailing List